Journey to
Water Synergy
About Water Synergy
Rhode Island is an ocean state where rivers and coasts are common. None of the three of us on our team are native Rhode Islanders, but the abundance of water resources in Rhode Island and the fact that bodies of water are spread out in various locations, and Rhode Island's proximity to the ocean make it obvious that water is a crossroads of nature and human construction in Rhode Island, and the proximity of our residences to the rivers, but the lack of monitoring systems for the rivers, and the inability of residents to understand and recognize the environment in which we live, has given rise to the idea of interest in conducting research on the river.
Project team
-

Yue Xu
Textile Designer, RISD
-

Jixin Zheng
Print Designer, RISD
-

Pratikesh Pundkar
Industrial Designer, RISD
Research Approach and Project Planning
We have studied water level changes in Rhode Island rivers over the past year, and have determined that during the winter months in Providence, Rhode Island when we are conducting our experiments and collecting data, the river levels are at their lowest point of the year. At the same time, we have data to show that during the winter months, water quality in Providence's rivers is at a relatively good point in the year.
Territory Planning
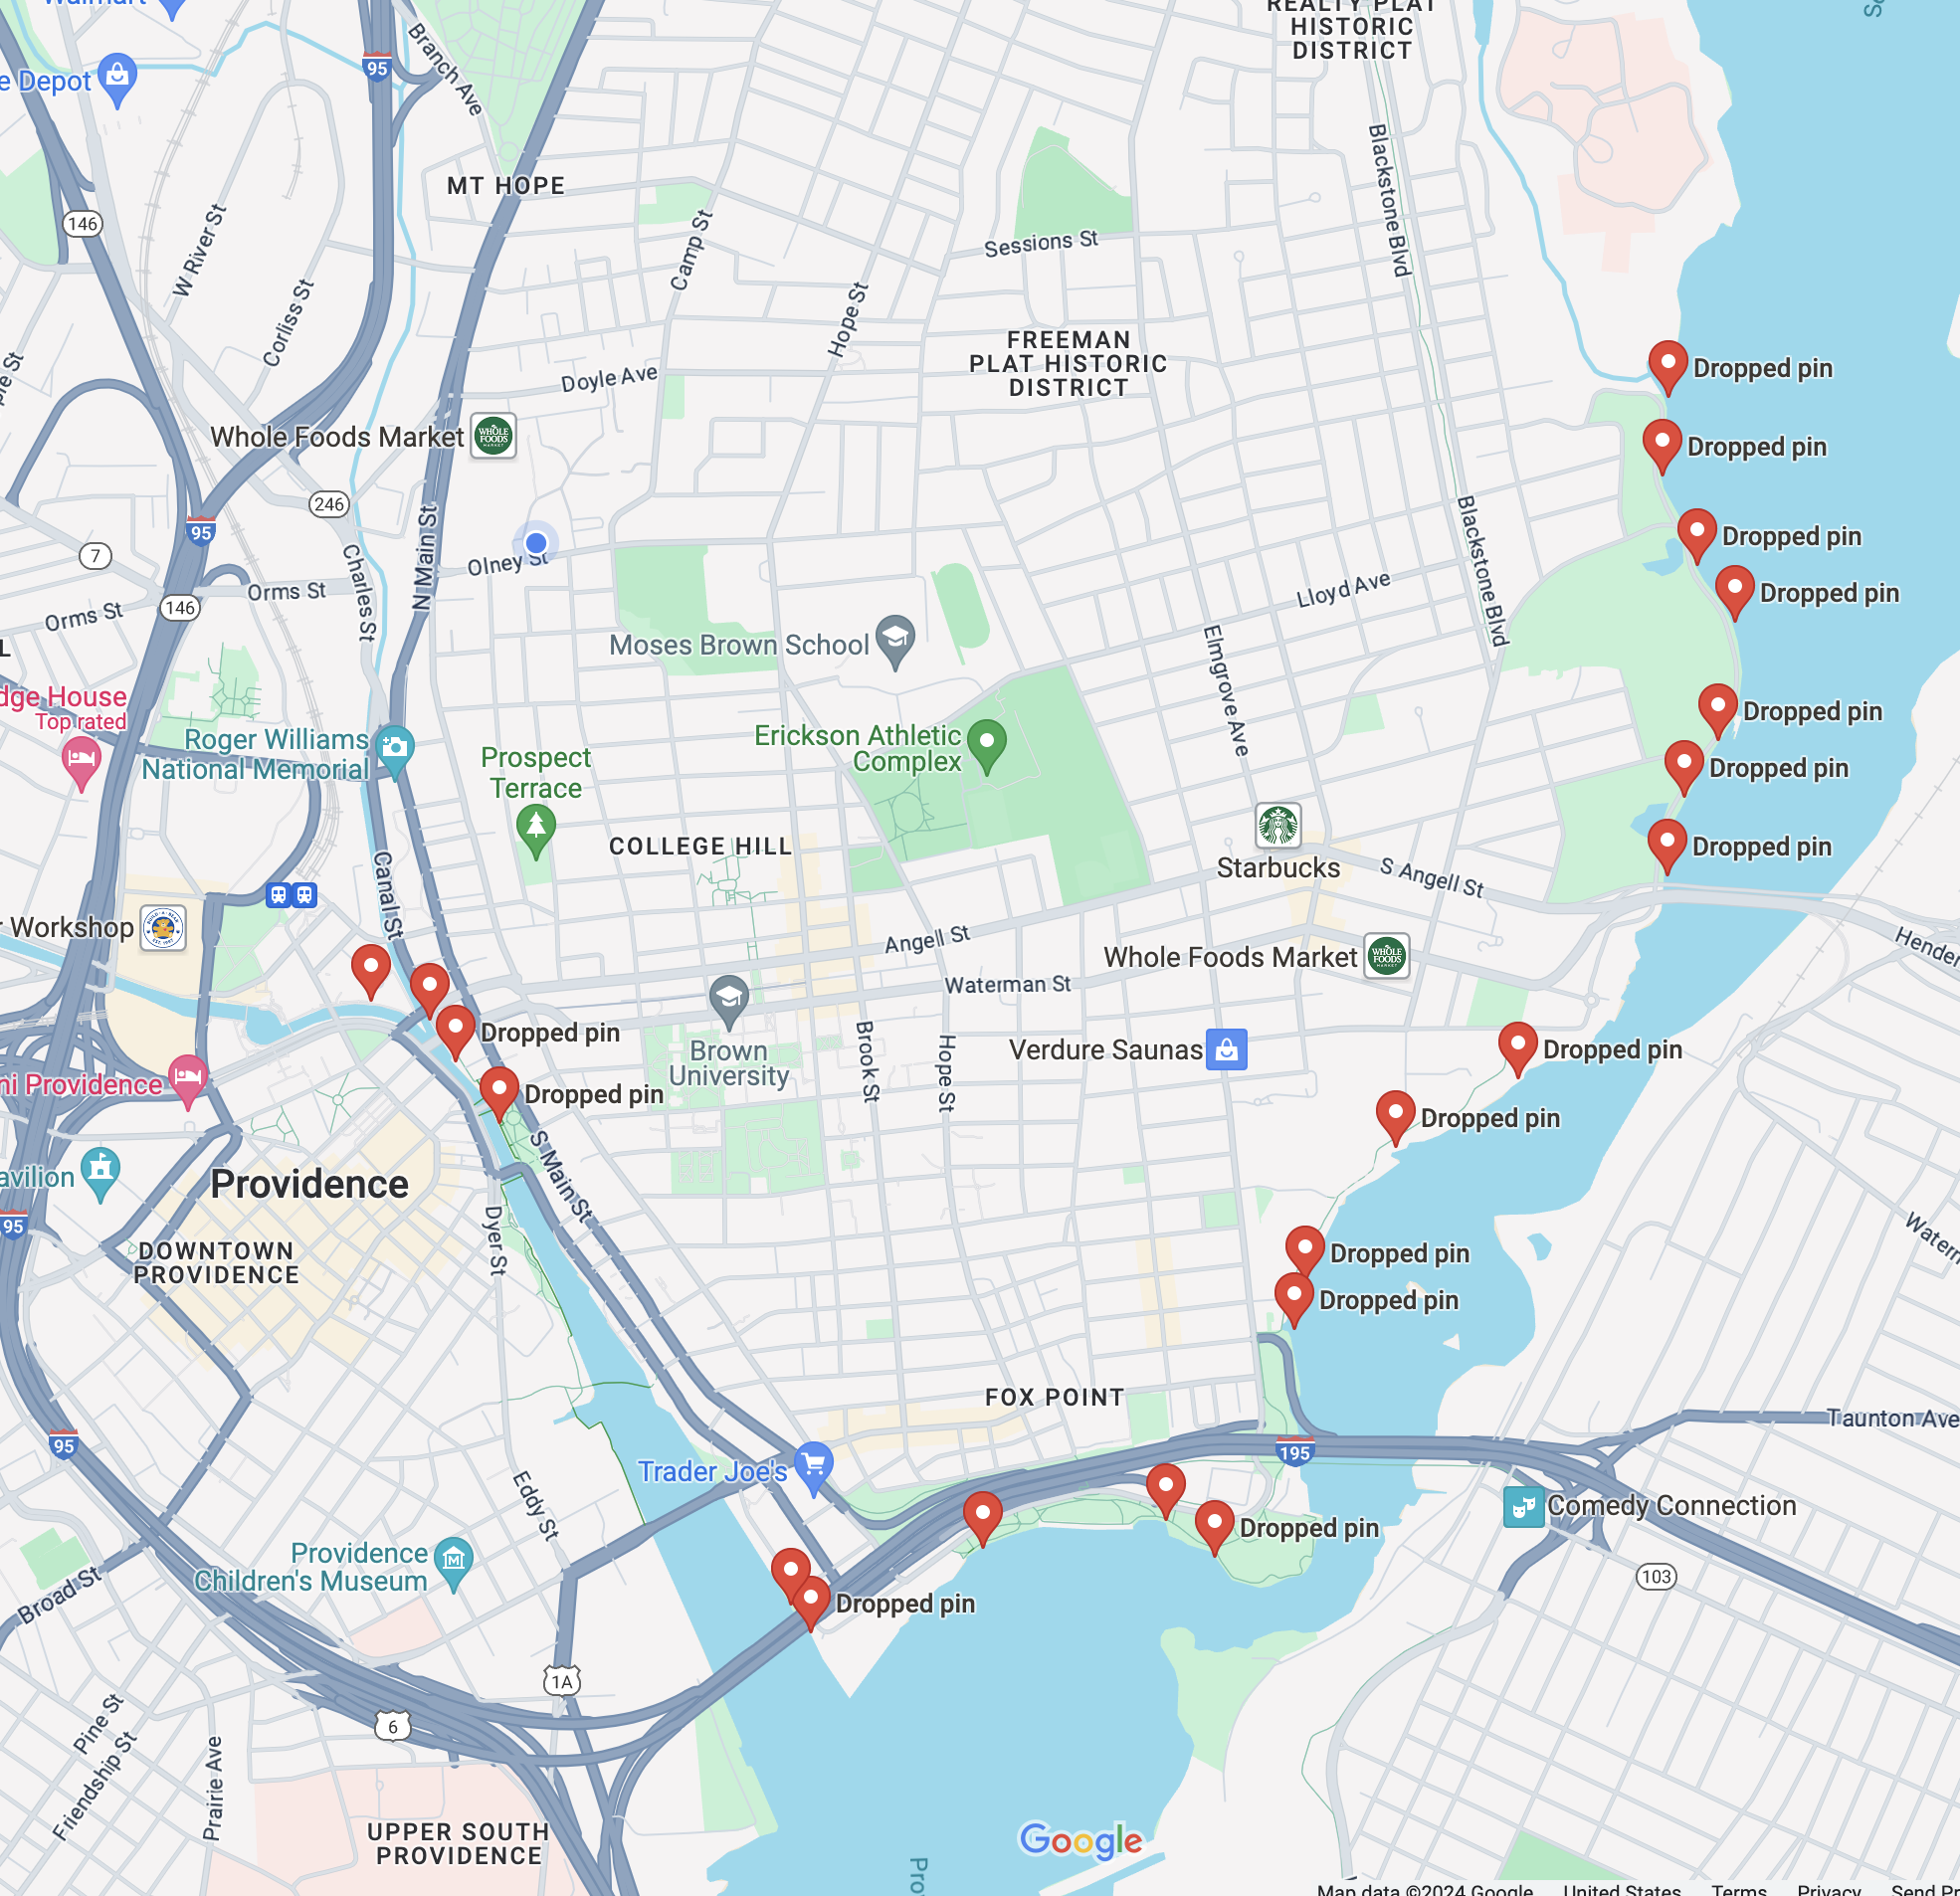
We focused our water sampling on three areas, and there were twenty-two specific sampling points within these three areas. These included the six sampling sites at Providence River, one sampling site from the Moshassuck River, and one sampling site from the Woonasquatucket River in Downtown Providence. We then walked along the river to Providence Harbor where we collected three samples and along the shore to the Seekonk River, we marked eleven sampling sites.
Field Exploration
We compared the data we collected and tried to find correlations between the various data. But admittedly, this is not always an easy task when it comes to water testing. The limitations of our testing tools and the limited time available to us are a great hindrance to our hydrological observations. Our intent was to compare the water quality of three different types of water bodies in Providence in order to discover differences in water quality and potential correlations in the data from them.



Tools used
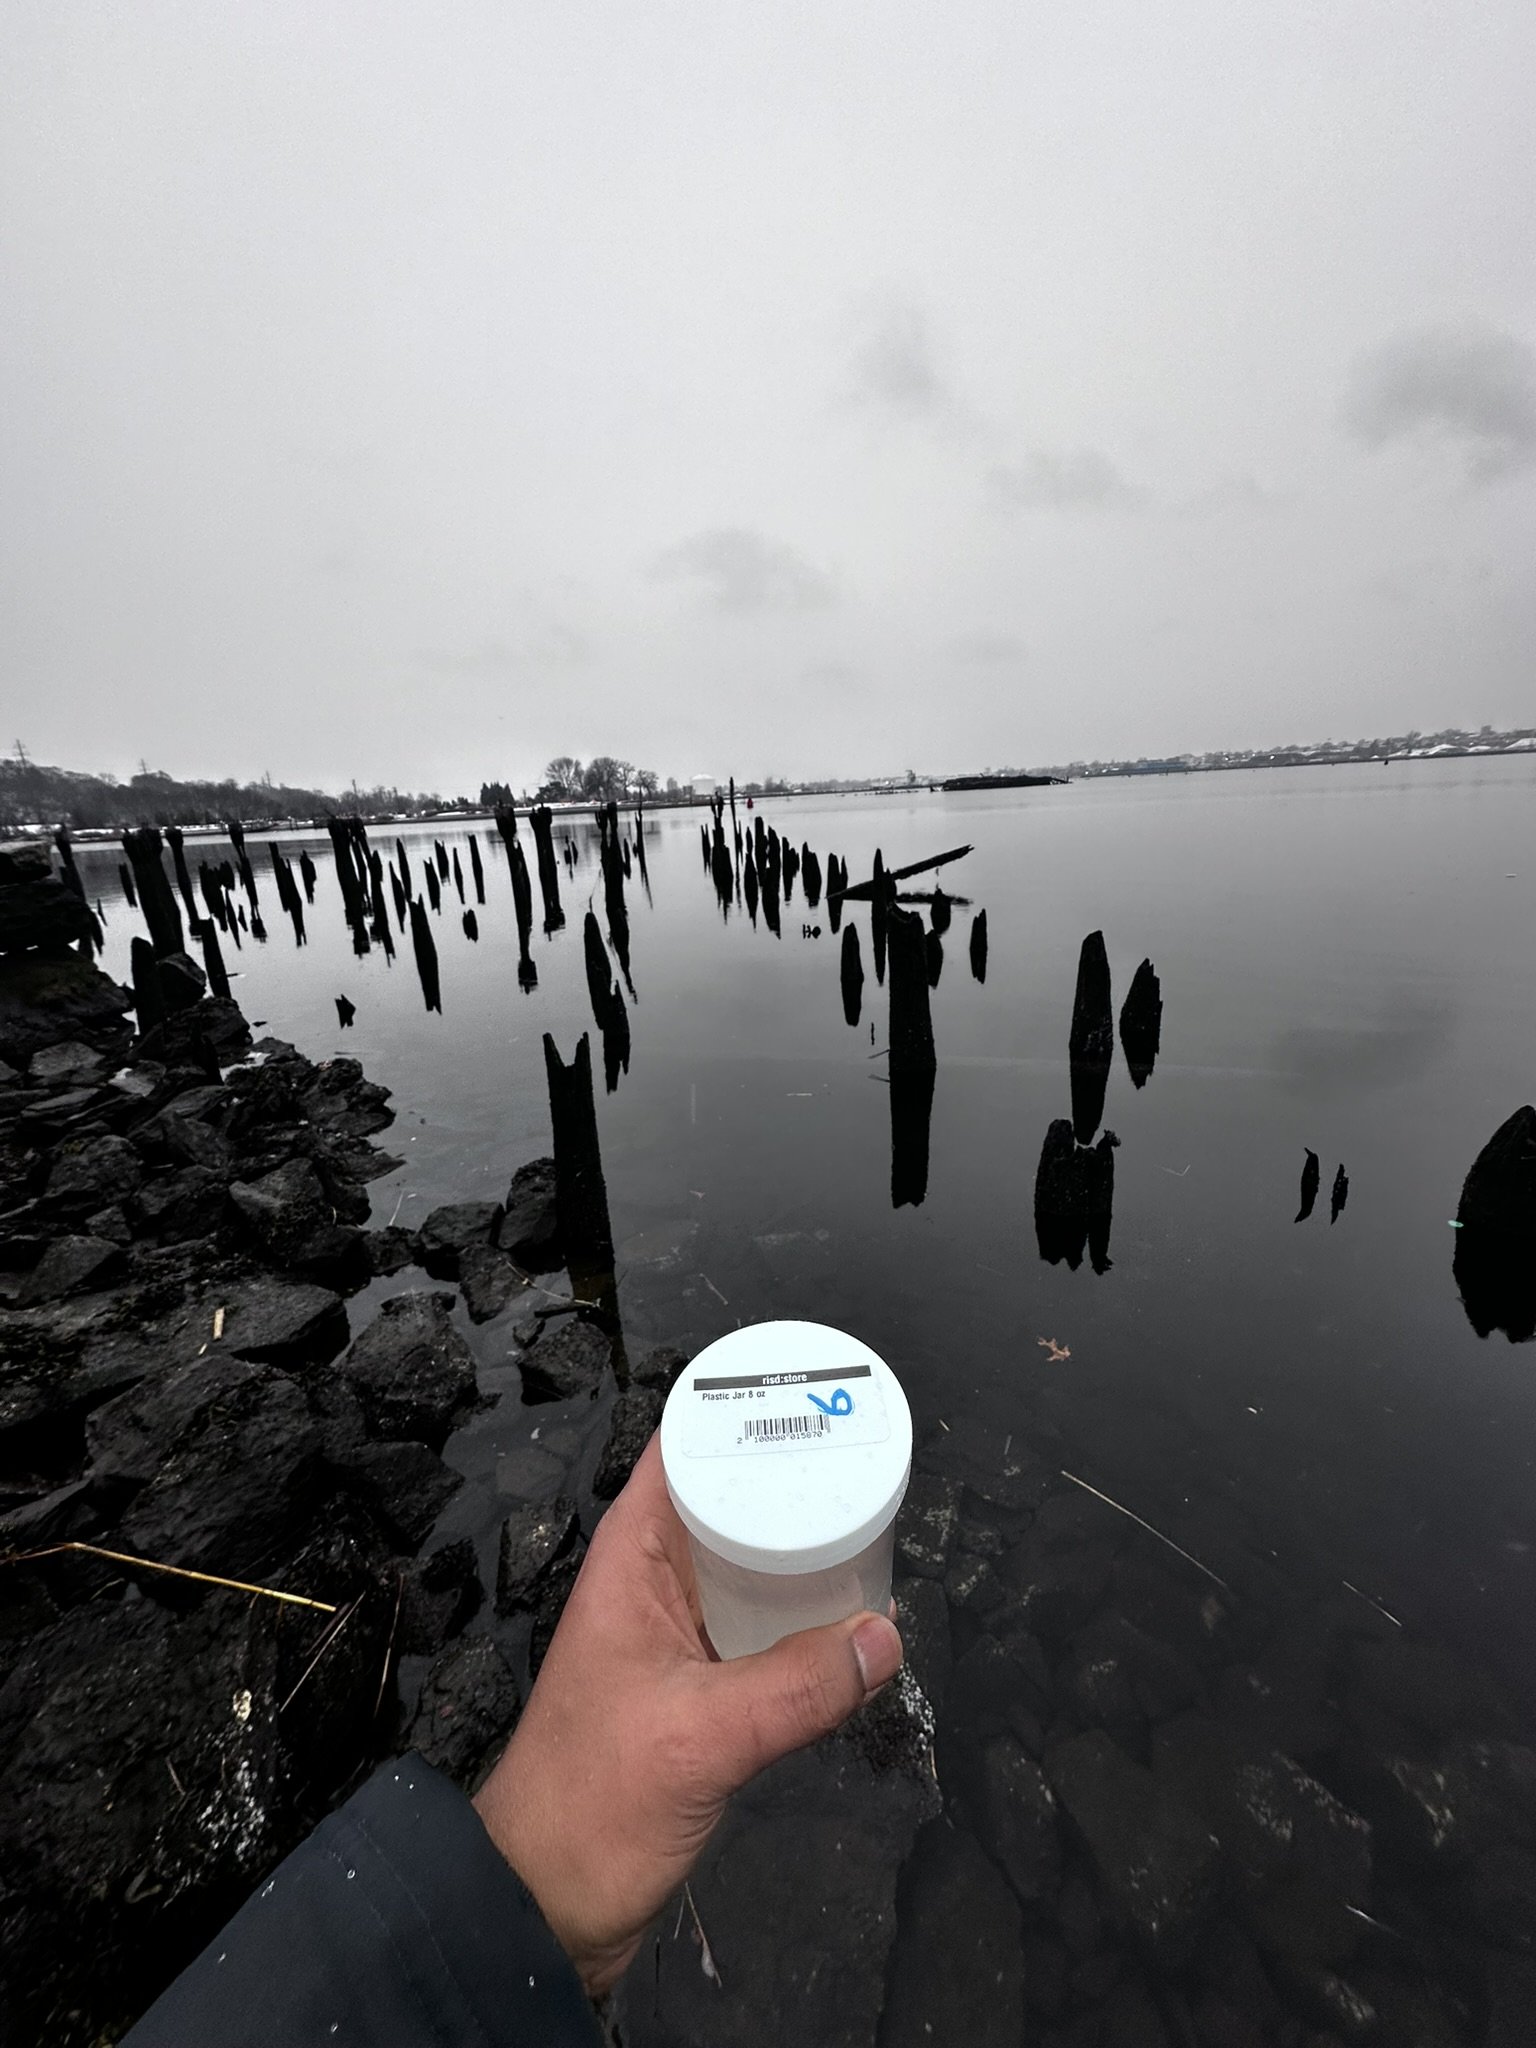
Several different types of equipment were used for data measurement and collection. First, for weather data, we use a Kestrel 5000 Weather Meter, which provides us with data on temperature, humidity, and wind speed. For water quality measurements we used the 16 Parameter Water Test Strips from Verify; this test kit allows us to know the pH, hardness, hydrogen sulfide, iron, copper, lead, manganese, total chlorine, mercury, nitrate, nitrite, sulfate, zine, fluoride, sodium chloride, and total alkalinity. We also took some of the water samples we collected to RISD's Nature Lab to observe our water samples under a microscope. This allowed us to obtain photos and videos of some of the substances and organisms in the water.
At each data collection point, our team members were responsible for dividing up the work to record geographic data and time information that would be useful for subsequent data analysis.
Data collection
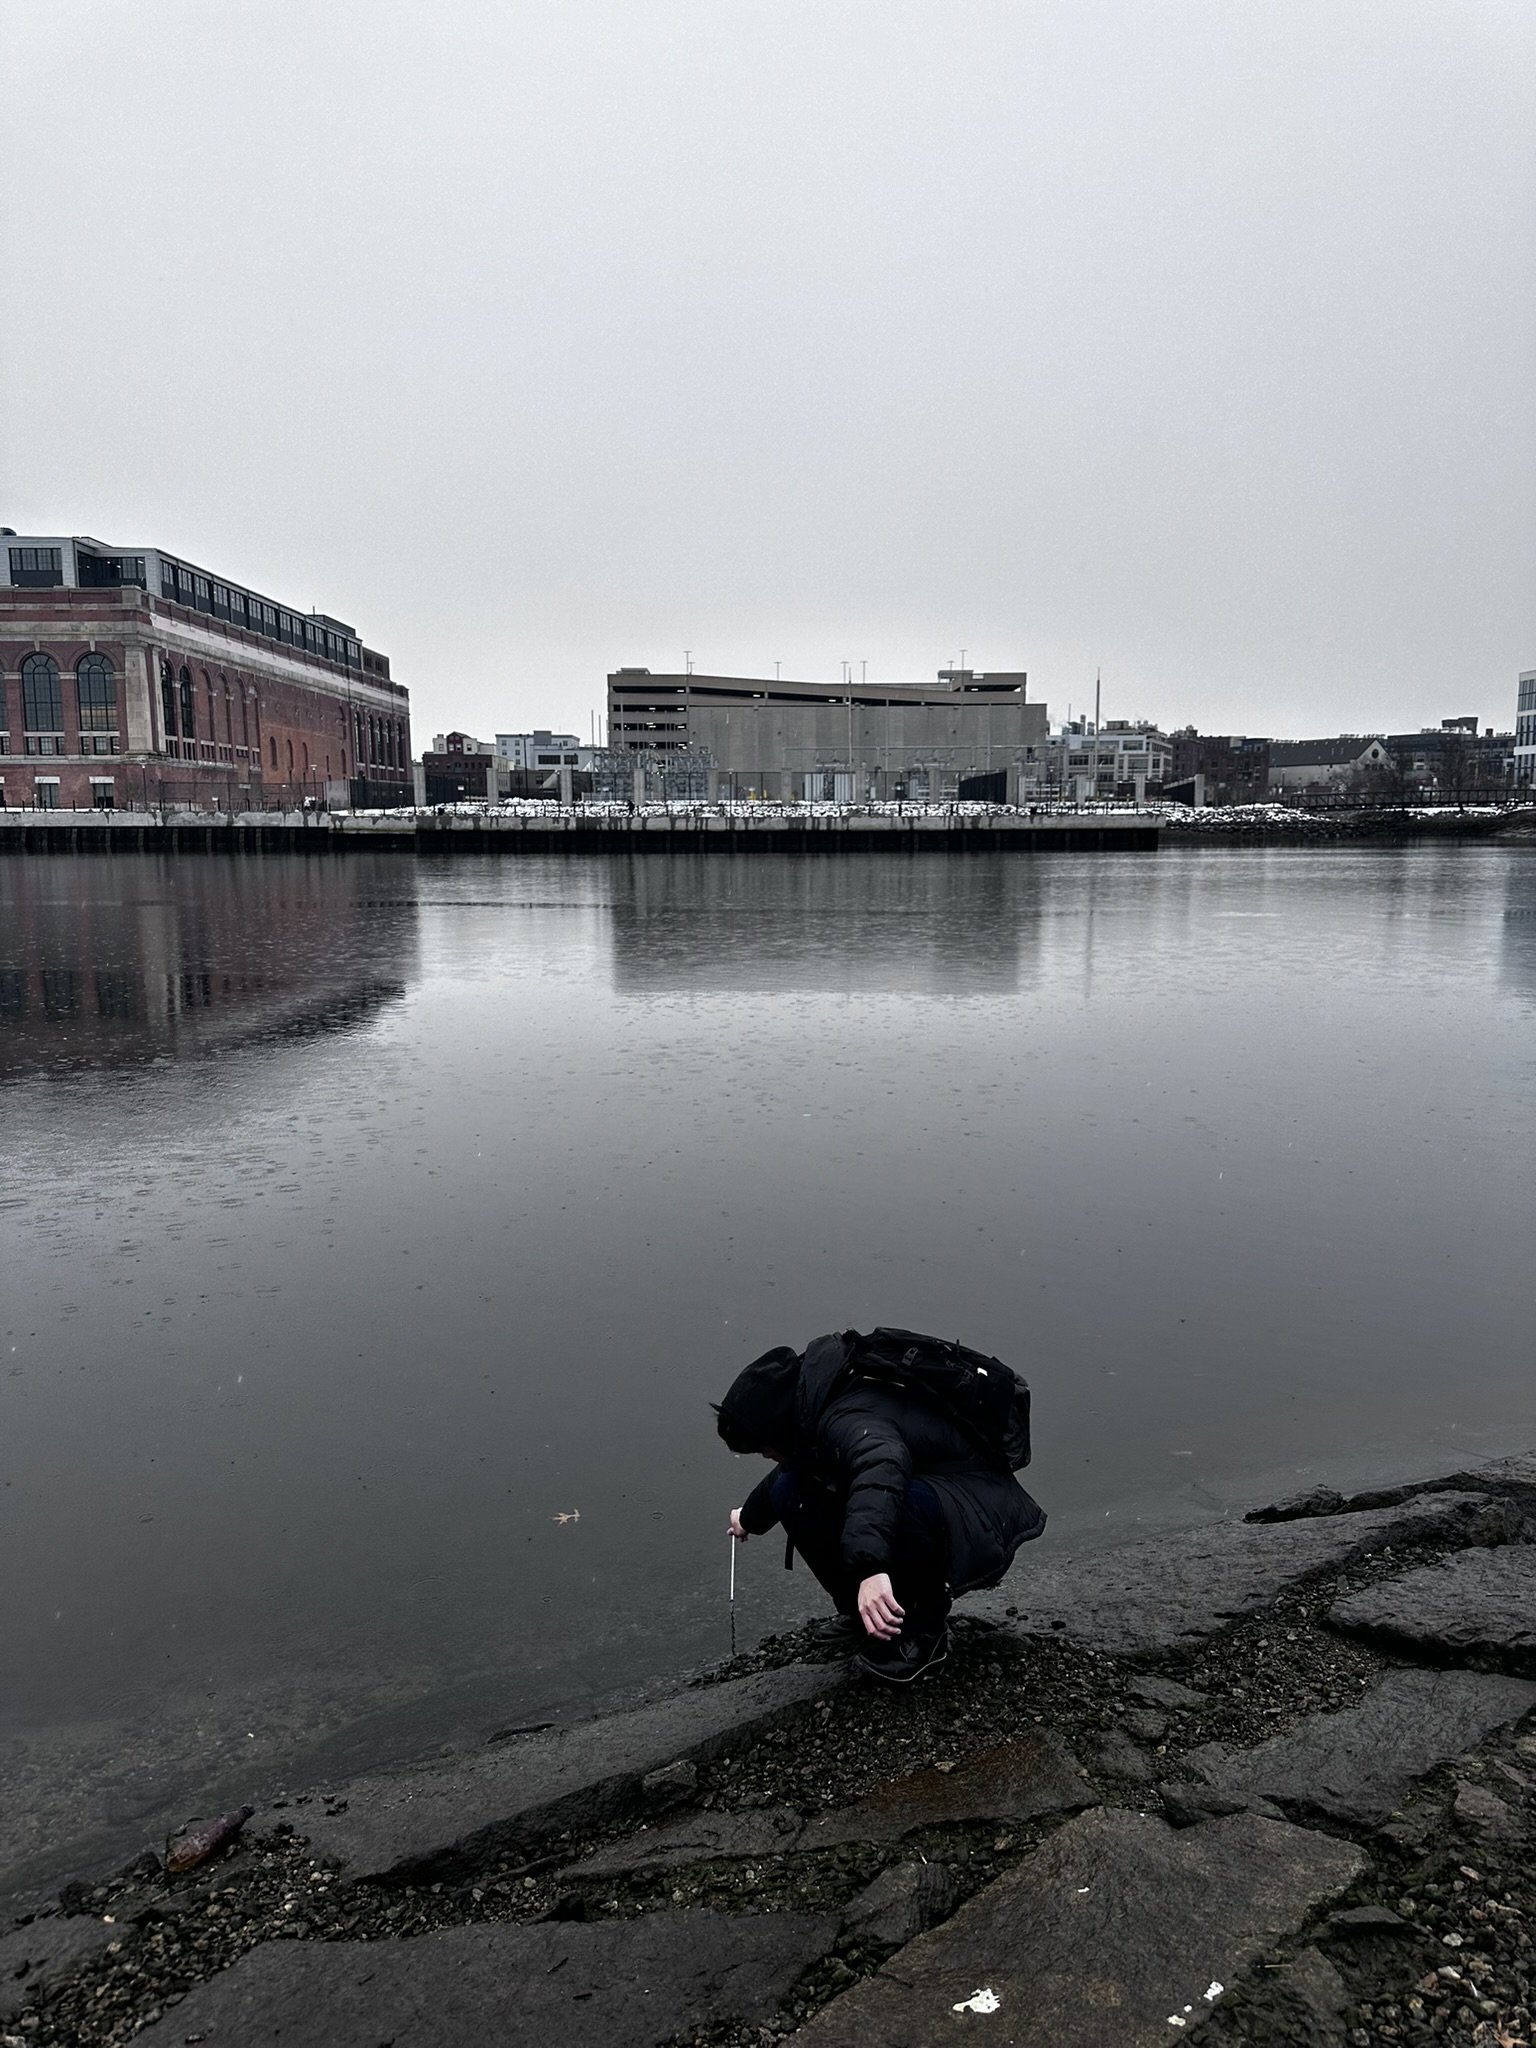
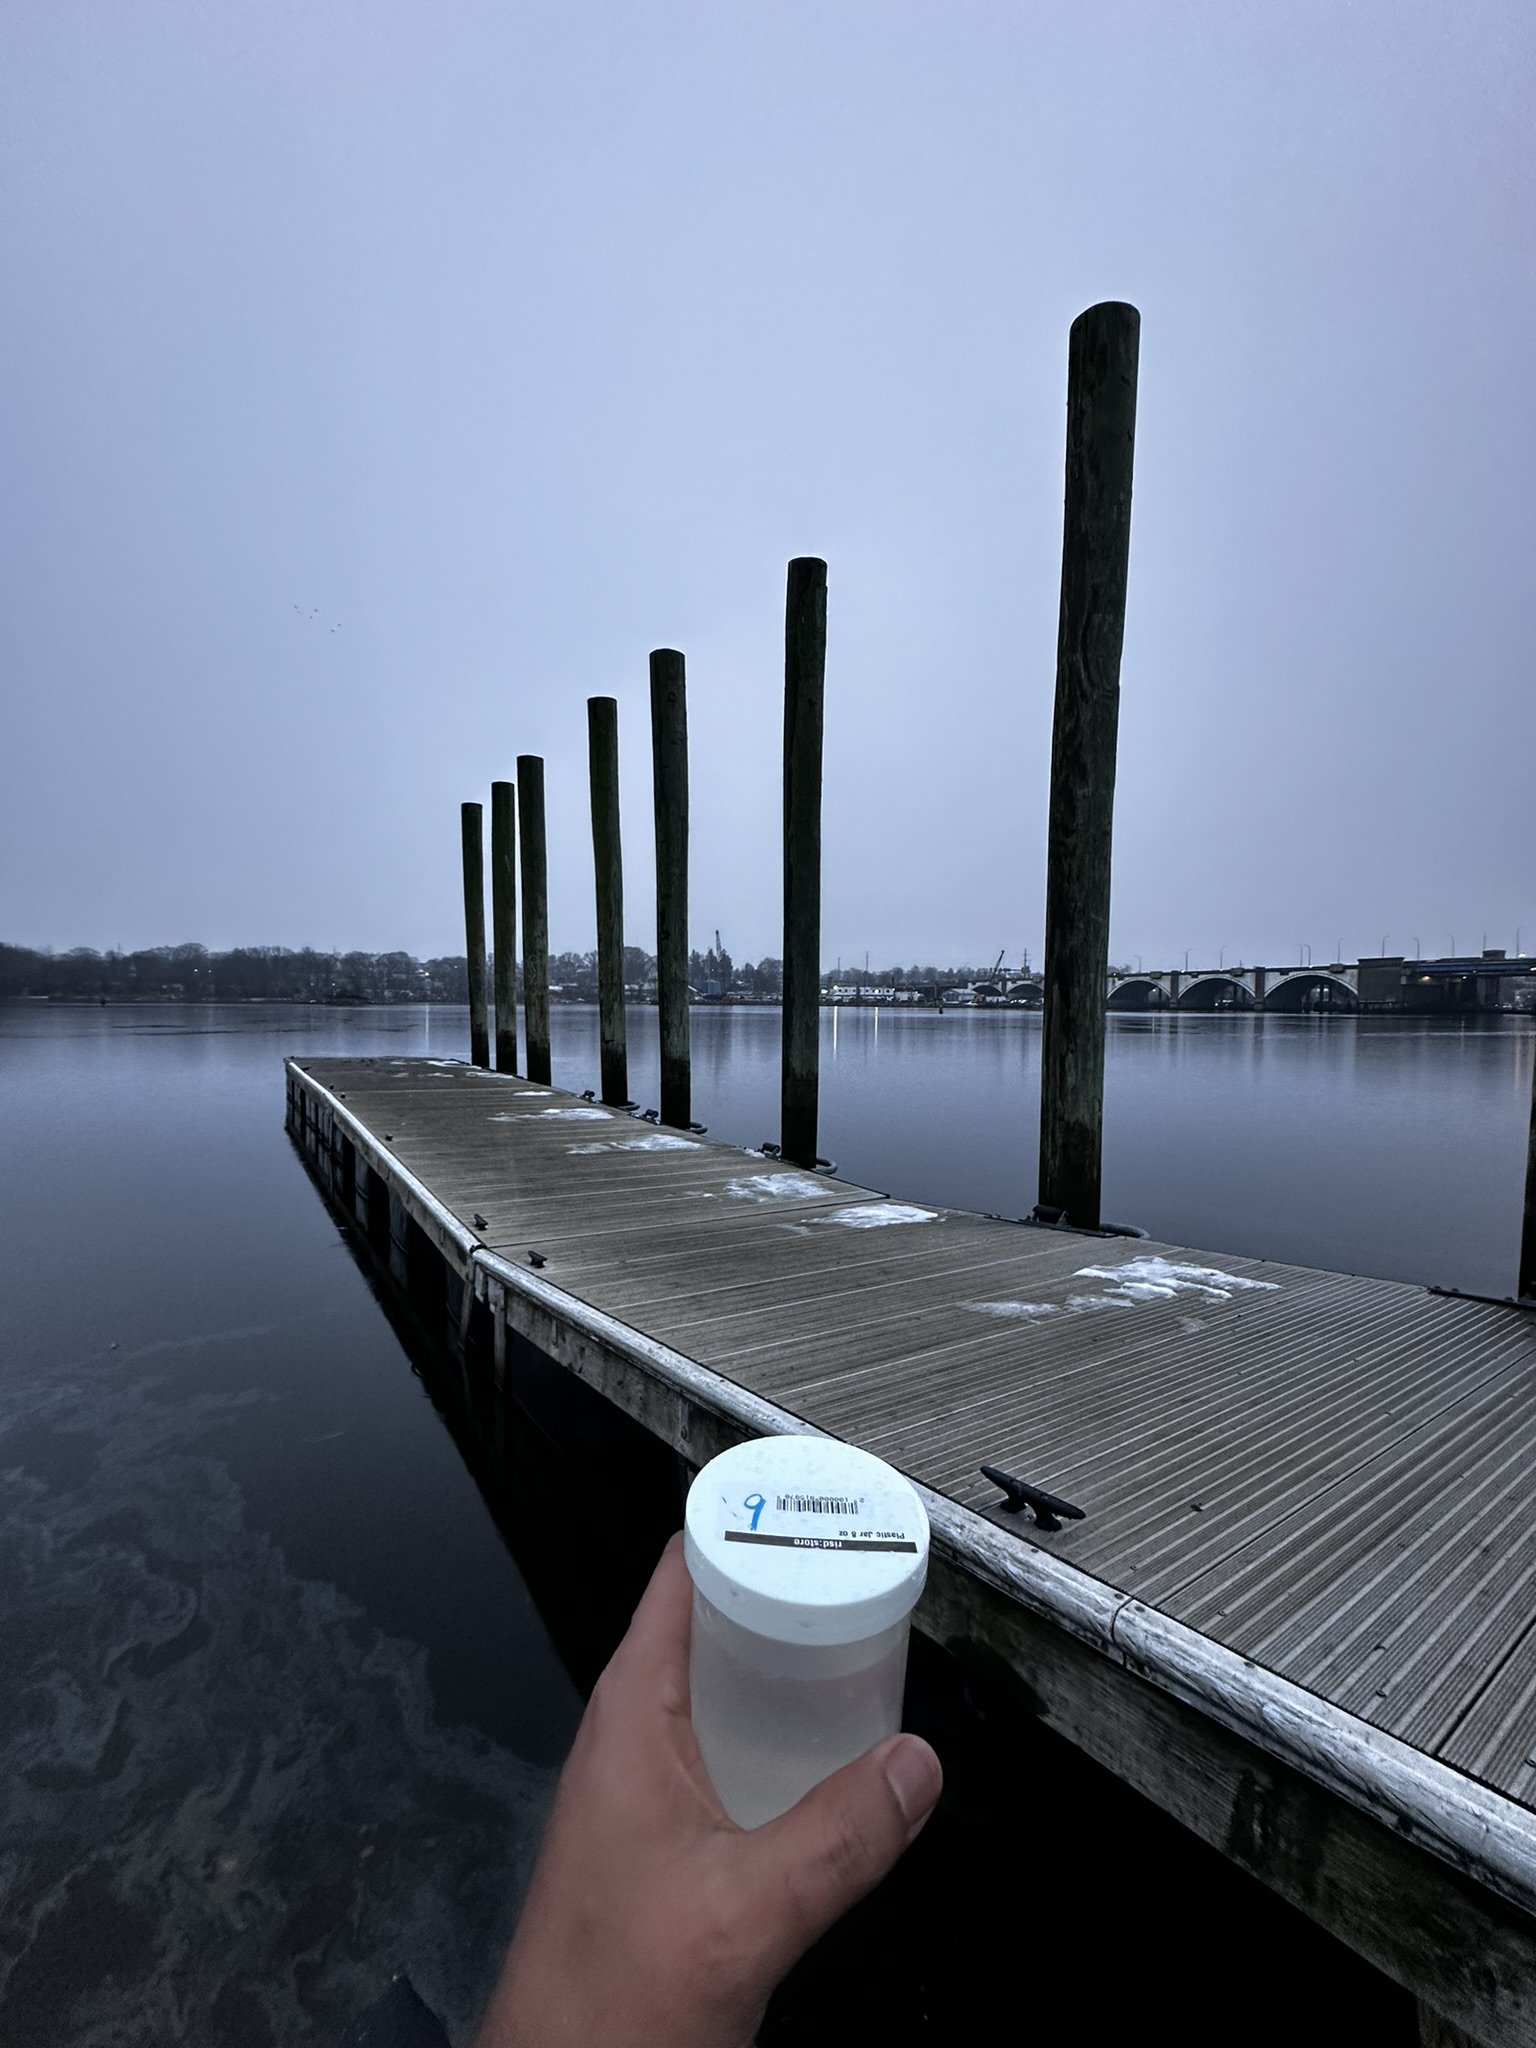
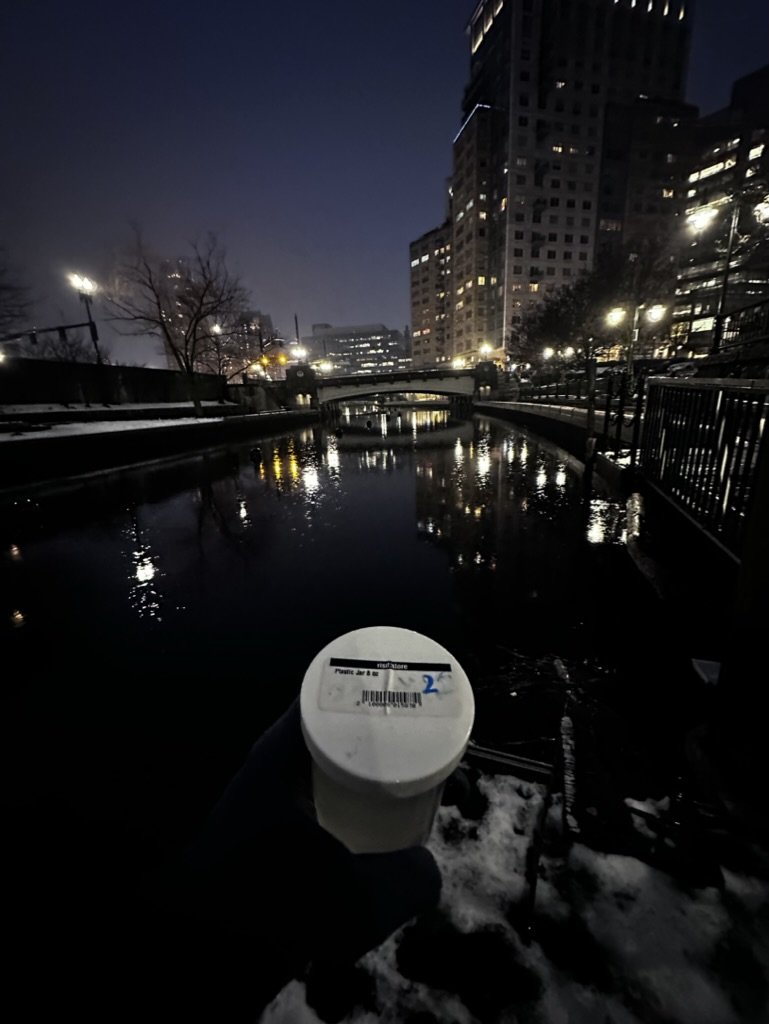
At each sampling site, we also measured two minutes of weather data, hoping to observe the connection between weather and water resources and to document the state of the day. Weather affects the river in some way, such as when it rains or snows. At the same time, each sampling point was photographed and the location of the sampling point was acquired to ensure the accuracy of the data. Due to the geography of the riverbanks, collecting water samples was not an easy task for us with limited experience, and there were some locations where collecting was hazardous, such as cold weather causing ice to form which could cause the collector to slip and fall into the water.
Questions we explored
What is the difference between the water quality of different water sources in Providence?
What are the correlations between the different parameters of water and weather data?
Will the human intersection with the water change the water composition in winter?
How this data will make us more aware of the coexistence with water streams around us?
Graph 1: Map graphs of data collected
This graph shows the 22 sites, providing information about their geological location, the water source they belong to, and the time of the team’s visits.
Graph 2: Ridge Line Plot
This graphs show the distribution of the daily river gauge height of the Moshassuck River per month in the past year.
The water level rises to a higher spectrum in the fall and winter months than in summer. The graph also provides contexts for the team’s investigation. The team’s site visits take place in January when the water level distribution is not as concentrated and reaches the largest range in the past year. There’s also considerable distribution in the highest spectrum due to more snow and stormwater run-off.
Reference -
Graph 3: Heat Map
This graph lists all the measured parameters and their relative values per site.
The graph indicates some general trends in water quality and weather in space and indicates further investigations in the next graphs. It should also be noted that some parameters tested zero, or an undetectable low value. Water bodies near pipelines and tap water might take on iron and copper, but according to our results, the Providence rivers are free from them at the moment. We also expected a certain level of nitrate(NO3), nitrite(NO2), or phosphate due to sewage and wastewater runoff. It was good news that all our samples tested clean with these variables, but their values might still rise as the weather gets warmer, increasing the risk of excessive algae growth and eutrophication.
Graph 4: Correlation Matrix
This graphs cross-check the dependence between every selected parameter and one another.
The variables line up diagonally with their density maps. The upper panels map every two variables in a scatter map, while the lower panels map their dependency to a color scale, highlighting the pairs with the higher relevance in stronger colors. The graph indicates a strong positive correlation between sodium chloride and general hardness, a negative correlation between humidity and air temperatures, and a positive correlation between humidity and dew point temperatures. These parameters will be further explored in the following graphs.
Graphs 5 and 6: Density Plot
This graph is showing the distribution of general hardness values and sodium chloride with respect to the water source.
General hardness measures the concentration of Calcium and Magnesium salts in water.
In this graph, following the direction in which our samples were taken, more ocean water flows into the Seekonk River rather than into the Providence River, which results in more Sodium in the Seekonk River, which comes from the Providence Harbor. The water is soft at our starting point and hard at our ending point in the Seekonk River, which may be related to the minerals contained in the water, as a large amount of seawater from Providence Harbor flows into the Seekonk River, which results in more sodium being mixed in, which may be one of the reasons for the harder water.
Graph 7: Stacked Area Plot
This graph shows the relative change in general hardness, sodium chloride, sulfate, and total alkalinity along the riverside. Highlight the abnormal values.
Alkalinity measures the water’s capability to recover from acidic pollution, such as acid rainfall and snowmelt caused by sulfur/nitrogen dioxide emissions. Carbonate and bicarbonate contribute the most to water’s alkalinity. The total alkalinity values are mostly below the cut-off line. During the current season with frequent rain and snow, the local rivers' defensive system against acidity could get compromised. Long-term exposure to acid rain and sanitizers might also impact the rivers’ health.
Graph 8: Scatterplot
This graph shows the relationship between four different temperature indices and the relative humidity.
The part of the exploration focuses on the weather conditions along the riverside. The weather meter keeps track of four different temperature indexes.
Air temperature measures the direct value. Heat index and wind chill are both temperatures by perception. The former decides how the human body feels, while the latter considers wind speed as a factor. These three values line up with each other in our measurements and have a negative relation to humidity. According to the graph, the human body feels slightly colder in less humid conditions, but the gap disappears as humidity increases. For the times and sites of our measurements, the wind makes almost no contribution to the perceived temperatures.
Dew point temperature is an index that draws the connection between temperature and moisture in the air, indicating how comfortable the air would feel. When relative humidity increases, the gap between dew point temperature and air temperature becomes smaller. The comfortable range for dew point is between 10-15 Celsius (50-60F). However, the values in our measurements indicate that one would feel dried and not so comfortable under such weather.
Graph 9: Box plot
This graph shows the correlations between the four water sources in the Providence territory.
These boxplots show the water quality in the three different regions has different levels of hardness, containing different components of Sodium Chloride, Sulfate, and Total Alkalinity.
A case-by-case analysis shows that the Providence River has the softest water, while the Providence Harbor and Seekonk River are both high concentration of hardness. We hypothesize that this may be related to the velocity of the water, as we generally observe that the Providence River is relatively more turbulent than the Providence Harbor and Seekonk River. The longer the water stays in place, the more likely it is that minerals from the soil will dissolve into the water, resulting in higher hardness.
For Sodium Chloride, Providence Harbor is mostly seawater, so there is no doubt that it has the highest value, but by looking at the test data, we can also infer that more seawater is mixed into the Seekonk River than the Providence River.
For the result that Providence River has the highest amount of Sulfate, we speculate that this may be related to human activity because closer to the center of town, there is more human activity, and with Sulfate being present as a common cleansing formula, fertilizer, and gypsum formula, it would make sense that it would be present more where there is more human activity.
As for the alkalinity of each place, it should be viewed in the context of the marine environment, and the acidification of seawater is an environmental problem that mankind must face. Waste discharged from human activity can cause acidification of water bodies, and the Seekonk River has a higher alkalinity, suggesting that there is less human activity in the vicinity and that the water quality is better than in the Providence River. These conclusions can be differentiated by what can be seen with the naked eye.
Conclusion
As a result of our research and analysis of the data, we have gained a general understanding of the water quality of the Providence River, Providence Harbor, and the Seekonk River, and a preliminary understanding of the direction of flow. We must admit that to know more about Rhode Island's water quality and to analyze the data more constructively, we need professional water quality testing equipment, a larger sample size, and a longer observation time. However, our team feels that this is still a good start to understanding the impact of human activity on water quality even with limited measurement equipment and time. Every day we stand at the crossroads of water, and every step we take will have an impact on it.


